Visualizing (Security) Data

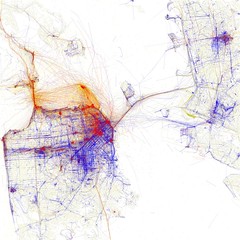
I recently wrote about some interesting urban color maps that were created from photo geotag data. Today I noticed Doug McCune has posted an urban topographical map in a post called “If San Francisco Crime were Elevation”

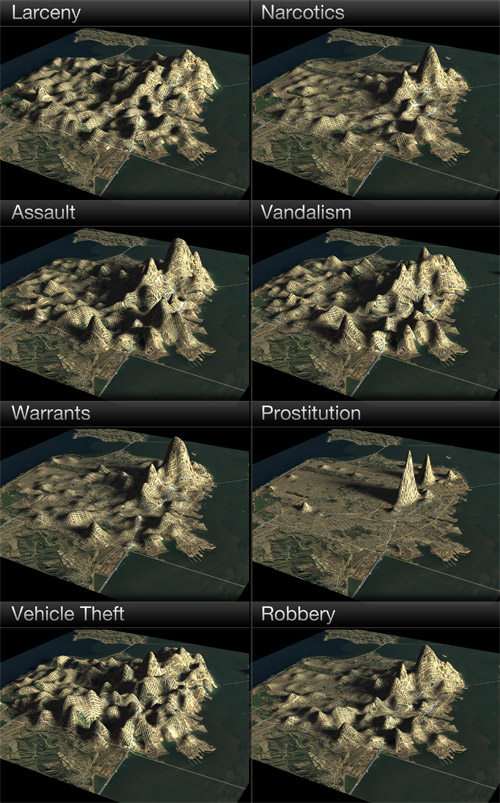
I’ve been playing with different ways of representing data (see my previous night lights example) and I decided to venture into 3D representations. I’ve used a full year of crime data for San Francisco from 2009 to create these maps.

One of the conclusions of his post is that physical boundaries can be credited for “valleys” in high crime areas.

There are other consistent features in these maps, in addition to Mt. Loin and the Mission Range. There’s a valley that separates the peaks in the Mission and the peaks in the Tenderloin, which is where the freeway runs (Valley 101). You’ll also notice a division in many of the maps that separates the southeast corner. That’s the Hunter’s Point Riverbed (aka the 280 freeway).

Quick, build more freeways through San Francisco! That should help reduce crime. Just kidding. He gives a disclaimer that the maps are meant to be artistic. See for yourself:

Living like a flatlander never looked better.

I like the fact that the maps both pinpoint trouble areas but also show rates relative to each other. I think a colored bar or cylinder sitting on the map might be more clear but definitely less artistic.

Aside from being more artistic, however, there also could be value. Topographical maps of risk could be very useful when integrated with classified ads. See a home for sale? What’s the VE (vandalism elevation)? What’s the AE (assault elevation)? How does the AE compare with another home for sale? Likewise, it would be interesting to use topographical maps to represent water quality, air quality, etc. and then display an overall risk elevation for a residence or workplace.

Another risk that could be interesting to map this way is based on photo geo-tag data that I mentioned earlier. What is the likelihood of exposure, or perhaps privacy loss (locals and tourists snapping photos or surveillance cameras), in your neighborhood? Would areas that have more exposure from cameras correlate to less crime? I am curious to see a map like this for cities like London with extensive surveillance systems.

Google Chrome Vulnerability Disclosures

Webkit is the foundation of Apple Safari and Google Chrome. Yesterday both companies announced security patches for their browsers, many related to Webkit. Here is a sample of just one from the Apple Safari update page.

WebKit

CVE-ID: CVE-2010-1398

Available for: Mac OS X v10.4.11, Mac OS X Server v10.4.11, Mac OS X v10.5.8, Mac OS X Server v10.5.8, Mac OS X v10.6.2 or later, Mac OS X Server v10.6.2 or later, Windows 7, Vista, XP SP2 or later

Impact: Visiting a maliciously crafted website may lead to an unexpected application termination or arbitrary code execution

Description: A memory corruption issue exists in WebKit’s handling of ordered list insertions. Visiting a maliciously crafted website may lead to an unexpected application termination or arbitrary code execution. This issue is addressed through improved handling of list insertions. Credit to wushi of team509, working with TippingPoint’s Zero Day Initiative for reporting this issue.

Compare that with the format for the same bug on the Google Chrome update page.

[43487] High Memory corruption in text transforms. Credit to wushi of team509.

That is it, just one line. 43487 looks like a tracking reference number that is internal to Google. I gathered this bug is the same one as the the one above from the credit reference to wushi. No CVE? No platform reference? I clicked on the number 43487, which points to code.google.com, so I could read more and confirm details…

Your client does not have permission to get URL /p/chromium/issues/detail?id=43487 from this server.

This is not very impressive. Moreover, it is inconsistent from earlier Chrome security notices that were done well. June 9, 2009 for example explained two WebKit security patches. Here is the first one:

Google Chrome’s Stable channel has been updated to version 2.0.172.31 to fix two security issues in WebKit.

CVE-2009-1690 Memory corruption
A memory corruption issue exists in WebKit’s handling of recursion in certain DOM event handlers. Visiting a maliciously crafted website may lead to a tab crash or arbitrary code execution in the Google Chrome sandbox. This update addresses the issue through improved memory management.

Severity: High. An attacker might be able to run arbitrary code within the Google Chrome sandbox.

Mitigations:

* A victim would need to visit a page under an attacker’s control.
* Any code that an attacker might be able to run inside the renderer process would be inside the sandbox. Click here for more details about sandboxing.

That was more like a normal patch announcement and clearly more useful.

Apple did a nice job. Why did Google switch to the weaker format and use internal links? Interesting also to note that the thing getting attention is not how little information they give but that they paid a $2000 bounty for just one flaw.

[$2000] [39985] High Cross-origin bypass in DOM methods. Credit to Sergey Glazunov.

San Francisco photos, Locals v Tourists

Maps of cities are now being generated to differentiate where people are taking photos, based on geotag data. This is a view of San Francisco (blue for locals, red for tourists):

Locals and Tourists #3 (GTWA #4): San Francisco

Originally uploaded by Eric Fischer

Locals take photos in residential areas while tourists take photos in touristic areas. Should we be getting more insight out of this map?

What if we break it down by tourist home town, by gender and by age? How do tourists from Korea compare with Japan, or Germany versus France? It would seem the map becomes more informative the more sensitive/privacy data is available…and that is exactly the kind of pressure many companies feel when thinking about how to visualize their databases of customer information.