I find the six-sigma “bullseye” illustration of the accuracy vs precision problem… somewhat imprecise.
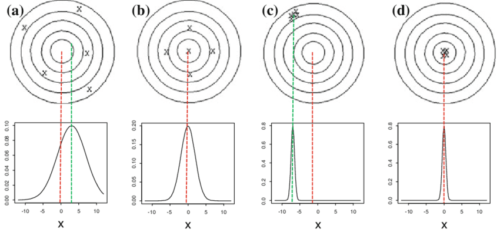
- (a) Not Accurate, Not Precise
- (b) Accurate, Not Precise
- (c) Not Accurate, Precise
- (d) Accurate, Precise
While it’s accurate to say that a bullseye illustrates the precise problem, surely there are more precise ways of illustrating overall the accuracy problem.
I mean there are so many “quality” applications other than trying to narrow everything to a point in order to shoot or bomb it — the obvious reference of a cross-hatch.

LiDar to the rescue! I found the following vendor diagram very refreshing as it relates to big data security controls.
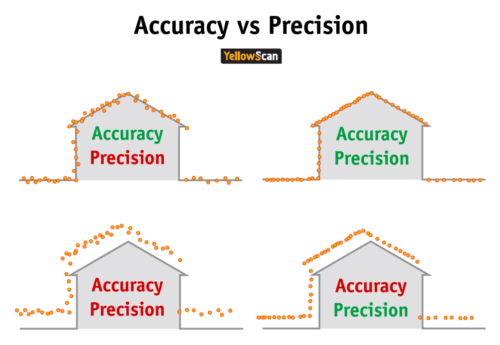
Ok, maybe that’s still an illustration of targeting… by an over-the-horizon drone strike meant to eliminate an entire building. *Sigh*
My only real complaint though for this kind of superior illustration is that red/green are biased, subject to colorblindness. Was it too hard for them to use the word “not”?