IBM Opens African “Smart City” Research Center

This description is found in the IBM press release, on PR Newswire:

The single biggest challenge facing African cities is improving access to and quality of city services such as water and transportation. IBM, in collaboration with government, industry and academia, plans to develop Intelligent Operation Centers for African cities — integrated command centers — that can encompass social and mobile computing, geo-spatial and visual analytics, and information models to enable smarter ways of managing city services. The initial focus will be on smarter water systems and traffic management solutions for the region.

It sounds like a bold statement and move by IBM. Usually the top challenges in Africa are said to be internecine conflict, corruption and bureaucracy, which tend to keep businesses away.

If infrastructure development now has manageable risks then the stage could finally be set for explosive growth by business investment in areas without legacy systems to get in the way. That seems somewhat optimistic, though, given Kenya’s ongoing corruption problems.

Another possible explanation for IBM’s confidence in this venture is related to rising U.S. State Department interest in strategic influence over communication and information systems of Africa (Kenya ranks 3rd on the Net Index).

It will be interesting to see how Kenya handles the risks and liabilities that come from a foreign entity building big data repositories for them and a “smarter” critical infrastructure. The U.S. military has made it pretty clear they tend to want to predict movements of certain people on the Horn of Africa, especially when FBI are on the ground in Somalia. Military, intel and business objectives have an obvious overlap in the IBM proposal to build “command centers” and “traffic management solutions for the region”.

Human Predictability Paper Wins Nokia Mobile Data Challenge

“Interdependence and Predictability of Human Mobility and Social Interactions” by Manlio De Domenico, Antonio Lima, and Mirco Musolesi of the University of Birmingham, UK has been awarded the best entry in the Open category of the Mobile Data Challenge.

In brief, the paper shows how analysis of your mobile phone data correlated with social connections can predict your movements into the next day to a high degree of accuracy.

…we have shown that it is possible to exploit the correlation between movement data and social interactions in order to improve the accuracy of forecasting of the future geographic position of a user. In particular, mobility correlation, measured by means of mutual information, and the presence of social ties can be used to improve movement forecasting by exploiting mobility data of friends. Moreover, this correlation can be used as an indicator of potential existence of physical or distant social interactions and vice versa.

Predictability from mobile data should come as little surprise given that since 2008 a physics research team has suggested they can generate a very high accuracy rate.

Human behavior is 93 percent predictable, a group of leading Northeastern University network scientists recently found. Distinguished Professor of Physics Albert-László Barabási and his team studied the mobility patterns of anonymous cell-phone users and concluded that, despite the common perception that our actions are random and unpredictable, human mobility follows surprisingly regular patterns.

The new study, however, suggests that by watching the movements of mobile phones that are related by social network to the target mobile phone that the accuracy of prediction can be even higher. In other words it can even predict the rare variance to a pattern by monitoring relationship influences.

Forbes points out that the new study results were based only on monitoring 25 volunteers in Switzerland but will now be applied to “larger data sets that he will soon be getting from Nokia.”


Malte Spitz: Your phone company is watching

Attack Source Location in Large Networks

Three researchers at the École polytechnique fédérale de Lausanne (EPFL) — Pedro C. Pinto, Patrick Thiran, and Martin Vetterli — have published a paper called “Locating the Source of Diffusion in Large-Scale Networks” that echoes the principle I presented on six months ago at RSA USA 2012:

How can we localize the source of diffusion in a complex network? Due to the tremendous size of many real networks — such as the Internet or the human social graph — it is usually infeasible to observe the state of all nodes in a network. We show that it is fundamentally possible to estimate the location of the source from measurements collected by sparsely-placed observers. We present a strategy that is optimal for arbitrary trees, achieving maximum probability of correct localization.

Following a common model in nature and science, with a nod to epidemiology as I suggested in my presentation, the authors propose an algorithm for using a highly reduced set of nodes in order to calculate source. In other words we don’t need to wait for data from every single end-point (100% infection) to find the source of an attack.

Here is the slide from my presentation at RSA Conference USA 2012Message in a Bottle: Finding Hope in a Sea of Security Breach Data

As I explained at RSA we can easily leverage the insight of Dr. John Snow’s map-based spatial analysis and algorithm (voronoi diagram) to find the source of attackers.

Measuring relationships (and the lack of relationships) creates clarity in finding sources. Steven Johnson, author of The Ghost Map, tells a colorful story of how it happened in the 1843 epidemic.

Back to the map itself and some fun math, Plus Magazine offers the following explanation of how a Voronoi Diagram/Thiessen Polygon can be used find influence of a specific point.

[Dr. Snow’s] next ingenious step was to represent the time it took to travel to the Broad Street pump on his map and to calculate who was most likely to use each water pump in the area. Snow drew a curve on the map that marked the points where the Broad Street pump was at equal walking distance from neighbouring water pumps. If you live inside this curve the Broad Street pump is your nearest source of water. Almost all the deaths marked on the map lay inside this curve and anecdotal evidence explained the few cases that did not.

Snow's Varoni Map

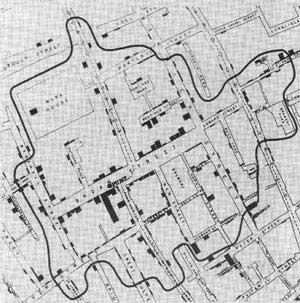
Michael Friendly offers this animated version of the map, which ends with the bright blue lines of a Voroni Diagram.

Of course Snow’s work is a major and well-known influence in all areas of science. However, in my extensive research from 2008-2011 on breach data and source location, I did not find any prior presentation or publication that suggested using Snow’s approach to solve attack source location in network security. That was exactly my point in presenting it in early 2012 and trying to draw attention in the RSA audience to solutions we can build based on a study of risk characteristics, causes and influences (epidemiology).

For comparison, here is a figure from the CLEP paper that was just released, which shows an estimated attack source location based on nearby yet “sparse” observations:

You could read that map as red for the water pump and green for each person infected by contaminated water. They say they are focused on “inferring the original source of diffusion, given the infection data gathered at some of the nodes in the network”. That sounds like Dr. Snow.

Moreover, their paper actually references a modern cholera outbreak to illustrate their theory; a figure in the paper is of “infected nodes” among “associated water reservoirs” almost exactly like the methods pioneered by Dr. Snow.

With all the obvious similarities, however, they make no mention of my RSA presentation regarding investigation of security breaches and even more shocking is an absence of any reference to the legacy of Dr. Snow.


Please note I will give an updated version of my presentation at the end of this month at RSA China 2012. Here’s a highly abridged version of my presentation produced by the RSA Conference last February:

Do US Power Companies Need a CISO?

IT World reports that the Department of Energy has released a new document that advocates for a senior security executive of security in power companies.

It calls for electric-power companies to appoint a senior executive for cybersecurity that will report to the companys board.

The IT World report also provdes the following analysis.

Senior management doesnt have a very good understanding of their security posture, says Andy Bochman, whose job as IBMs Energy Sector Leader in the IBM Security Systems Division grants him insight into how the whole U.S. power grid works.

Unlike other types of enterprises, many utilities today –whether its their enterprise business side or their industrial-controls systems side–do not have a chief information security officer (CISO) or a chief security officer (CSO) at all, says Bochman. But the evolution of the electric grid, especially as the so-called smart grid takes shape with more interactive information collection and management with consumers, means they need a CISO or CSO more than ever. He says they need an individual acting as a vice president of security who can report directly to the company CEO or board of directors. He adds its better here not to report directly to the CIO but go directly to the top of the company.

That sounds very strongly worded. I read the DoE report, called “Electricity Subsector Cybersecurity Capability Maturity Model, Version 1.0,” and I did not find very strong language about a senior executive. In fact, the term CISO (or CSO) does not appear anywhere in the document. This sentence on page 43, for example, is about the closest thing to advocating for a senior role.

A cybersecurity program may be implemented at either the organization or the function level, but a higher-level implementation and enterprise viewpoint may benefit the organization by integrating activities and leveraging resource investments across the entire enterprise.

“…enterprise viewpoint may benefit the organization…”

Likewise the term vice president is only mentioned as a side-bar within the 92 page document. You will find it in the “Example: Cybersecurity Program Management” section on page 44.

Anywhere Power decided to establish an enterprise cybersecurity program. To begin, it has formed a board with representation from each of the functional areas. This cybersecurity governance board will develop a cybersecurity strategy for the utility and recruit a new vice president of cybersecurity to implement a program based on the strategy. The vice president will also report to the board of directors and will work across the enterprise to engage business and technical management and personnel to address cybersecurity.

It’s a nice example, but only an example and not a requirement or even recommendation.
And then we have other examples like Google that keep security at the Director level (no VP, CISO or CSO) and do not even mention security on their Management team page.