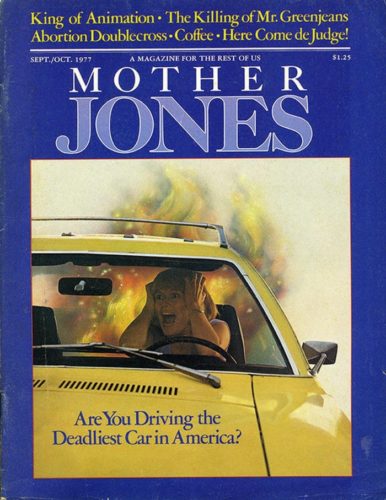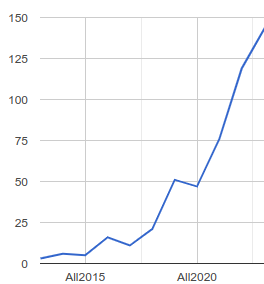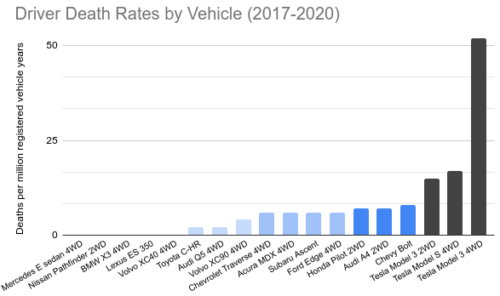
The Ford Pinto’s 23 total fatalities in the 1970s sparked national outrage and transformed automobile safety regulations forever. Today, Tesla’s safety record makes the Pinto crisis look quaint — “veered” Tesla crashes have reported over 20 fatalities in the past two months alone.
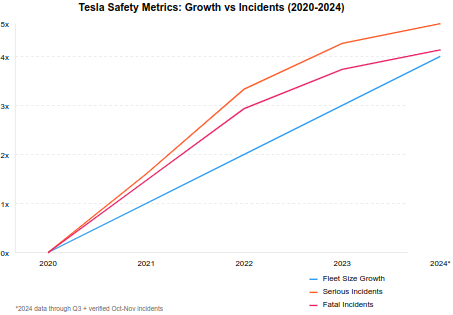
The rate of Tesla vehicles suddenly veering off roads is accelerating far beyond what a growing fleet would predict. Rather than seeing crashes increase proportionally with new car sales, data shows Tesla crashes occurring 5X faster than vehicles are being produced.
Consider Thanksgiving Day alone: A police officer was killed in a head-on collision while other police officers watched helplessly. That same day, three college students died when their Tesla slammed into a tree and burst into flames. Which story made your local news? The frequency of these incidents has become so overwhelming that media coverage has fractured into regional reporting.
Just this week in Australia, another Tesla veered off the road into a pole and caught fire, injuring both the driver and teenage passenger. Each incident becomes just another local story, lost in the growing sea of Tesla crashes worldwide.
The NHTSA and American media have been strikingly slow to recognize this severe public safety problem. When reporting on the recent Cybertruck crash that killed three college students, the Chronicle claimed it was only “the second known fatal crash in which a Cybertruck veered off the road and burst into flames for unknown reasons.“
Second known fatal crash?
Come on. We’re talking Tesla.
I’ll say it again: Tesla “veered” crashes have reported over 20 fatalities in the past two months alone! More like another crash among latest dozen known to be fatal, amiright Tesladeaths.com?

The recent police officer death stands out particularly because it happened while other officers watched helplessly as one of their own was struck down by an autonomous vehicle. But equally telling is the tragedy of the college students, which reveals a deeper pattern about privileged perceptions of safety and danger. These students came from Piedmont, a neighborhood in Oakland deliberately engineered by the KKK as a white enclave – maintaining 0% Black residents while completely surrounded by neighborhoods that are 30% Black. This wasn’t just historical segregation; it was fear-based marketing of “safety” through privilege and militarized exclusion.
Tesla’s marketing of the Cybertruck follows this same playbook. When Musk says
Sometimes you get these late-civilization vibes… The apocalypse could come along at any moment, and here at Tesla we have the finest in apocalypse technology.
…he’s tapping into a specific strain of white anxiety that has deep historical roots. We’ve seen this before — from Rhodesia’s white minority regime marketing itself as a “civilized” bulwark against Black majority rule, to gated communities promising protection from “urban” threats. The Cybertruck’s aggressive militarized design and marketing about surviving societal collapse appeal to the same fears that drove Piedmont’s formation: privileged white communities seeking technological shields against imagined threats from neighboring Black populations.
The bitter irony is that these carefully cultivated illusions of safety — whether through racial exclusion or supposedly apocalypse-proof vehicles — often create more danger than they prevent. Piedmont families who trusted in Tesla’s artificial promises of technological safety have now experienced firsthand how marketing that plays on fear can have tragic real-world consequences.
This isn’t just about vehicle statistics. It’s about how we evaluate risk through distorted lenses. Just as cigarettes were eventually banned because their dangers extended beyond individual choice to harm others, Teslas present a public safety threat that affects everyone on or near our roads. The question isn’t just what these families were thinking – it’s what we as a society are thinking as we continue to allow these vehicles to operate with minimal oversight.

